Sales Team Pulse Dashboard Example

Details: Tableau, SAP HANA, BI Data Storytelling Methodology

Super charge your sales team!

With a clear and focused view of all what’s selling and why, watch your sales skyrocket!

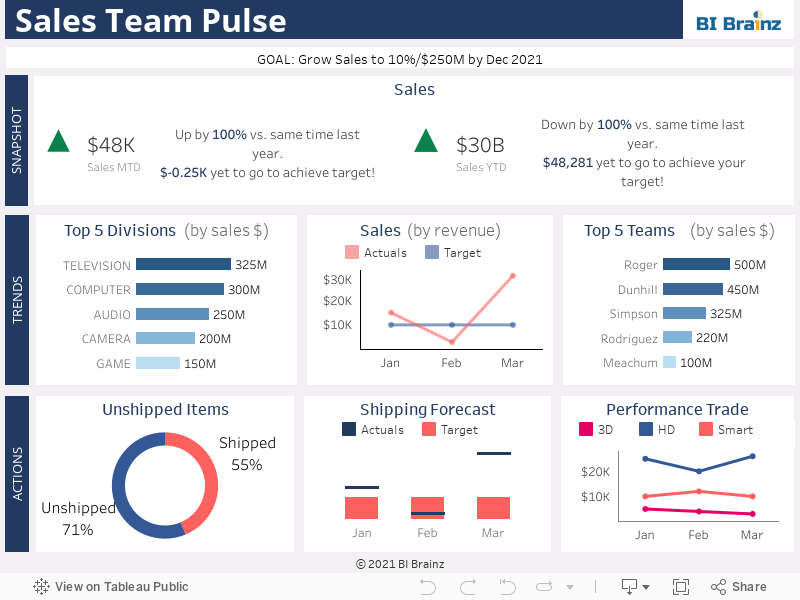
This simple sales team dashboard, shows you exactly what is selling, who is selling it and how to sell more.   Using story-driven, actionable KPIs (key performance indicators), this dashboard allows you to easily see both opportunities and risks, proactively closing the gap and keeping your sales team on track. 

Easily view details by clicking on any section of the dashboard or in a detailed report.

Want to see what our BI methodology
can do for you?

Let us show you with a free inside look at how our unique consulting services can start delivering amazing analytics within 72 hours!

SCHEDULE A

FREE CONSULTATION

Start here. We’ll arrange a time to talk this week about your BI project.

GET IN TOUCH

Ask us a question, or lets arrange a time to talk!