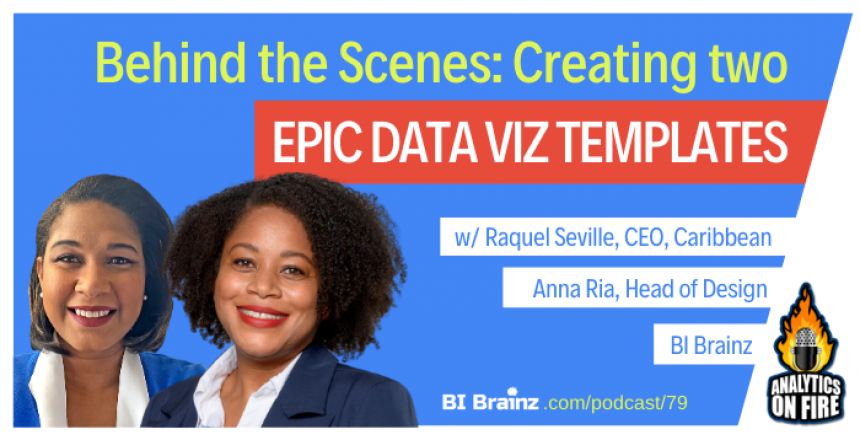
Today I’m taking you behind the scenes of how two women leaders from our BI Brainz team, created not one, but two of our most downloaded templates ever!
First, you’ll hear from Raquel Seville, CEO of BI Brainz Caribbean explains how she used our BI Data Storytelling Framework to transform a 271-page annual report into a simple, insightful Power BI Stock Dashboard template. Today, it has been downloaded hundreds of times and has gotten a thumbs-up from the company’s CEO! Learn how Raquel overcame receiving no input from the company and how she leaned our BI Data Storytelling methodology to create the story.
Then, we jump into part two with Anna, our Head of Design and well-known BI Data Storytelling Accelerator data viz design trainer as she shares the unique inspiration behind our popular Analytics Design Guide template and why she believes it was downloaded 600+ in the first 48 hours! She also provides some knowledge-bomb-galore advice for seasoned or new dashboard designers that wants to take their data visualizations to the next level! Both template are 100% free.. just check out he Resources section below and be sure to tune in today!
“We pulled heavily on the BI Brainz methodology – the BIDF methodology – and we pulled out the goal from the annual reports and used that to guide how we built the storyboard” [0:07:51]
Subscribe
Sponsor
BI Data Storytelling Online Live Accelerator
3-Day 100% Virtual Workshops with Mico & team! May 18-20, 2021
3 Knowledge Bombs
- Raquel on Why Identifying the Goal is Key - Without a goal, you are doing double the work! Identifying and narrowing down the goal takes the guesswork out of your dashboards and helps you use your time wisely.
- Anna on How Anyone Can Use the Analytics Design Guide - It helps standardize our client’s analytics and scale their teams by setting up guidelines that anybody can use, from total novices to dashboard wizards!
- Anna on The Importance of Storytelling - When you are trying to make a perfect creation, you need a story to do it! Every bestselling publication relies on a story format for success, and your dashboards are no different; you need a beginning, a middle, and an end.
In this episode, you'll learn:
- [06:10] - How Raquel built a single view dashboard from a 271-page annual report by focusing on a clear goal and following our BI Data Storytelling Methodology
- [09:55] - The significance of getting a thumbs up from the company’s (Grace Kennedy) CEO on social media.
- [10:16] - Why Raquel created the Power BI Stock Data Viz Template and why it's free
- [13:02] - How Raquel overcame certain challenges when things didn’t go to plan such as not getting any input from the customer on anything!
- [17:03] - Why, after identifying and narrowing down the goal, it was smooth sailing.
- [18:03] - Why Raquel co-founded the Jamaica Power BI User Group.
- [21:20] - Raquel highlights some of the women who inspire her and which books she recommends.
- [28:27] - Anna deep dives into what the Analytics Design Guide (or ADG) actually is: a set of guidelines that anybody can use.
- [30:46] - Who will benefit from using the Analytics Design Guide (ADG), from novices to dashboard wizards!
- [32:16] - What is so special about this design guide, compared with what is on the market.
- [34:08] - How the Analytics Design Guide (ADG) can help users that are “over creative” by honing in on specific areas.
- [35:10] - The story-driven analytics that drive the Analytics Design Guide (ADG) and why Anna believes that storytelling is crucial for success.
- [37:11] - The relationship between the BI Data Storytelling Accelerator and the ADG.
- [39:00] - Three steps she recommends for better design, starting with downloading the ADG!
- Right-click here and save-as to download this episode to your computer.
“When you are trying to make a perfect [dashboard], you do need a story to it.” [0:35:41]
Links and Resources mentioned in this episode:
- Raquel is CEO and Cofounder of BI Brainz Caribbean
- Raquel recommends the book, Data Visualization for Dummies by our very own Mico Yuk!
- Download the free Power BI Dashboard: Stock Data Viz Template
- As part of The Three Steps to Better Design, Anna recommends visiting Canva, Coolers, and Visualizing Data.
- Download our free 50-page Analytics Design Guide Template!
- Make sure to sign up for our upcoming BI Data Storytelling Accelerator!
Enjoyed the Show?
- Reviews on iTunes are extremely helpful and greatly appreciated! We read each and every one of them!
- Join the conversation by leaving a comment below!


