Our proven BI Dashboard Formula Methodology can help.
Eliminate Scope Creep · Skyrocket User Adoption · Create Compelling Data Stories
OR
Our BI Dashboard Formula methodology transforms how BI projects are delivered
Creating data-driven analytics in any BI tool has never been this easy!
The BI Dashboard Formula Methodology is a simple, 5-step proven process
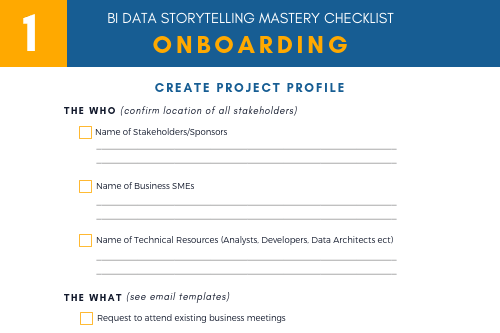
Quickly identify the key items needed to kick-off a successful BI project.
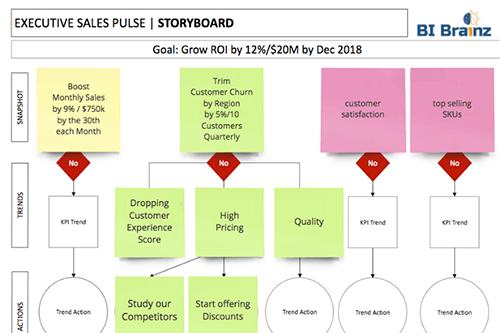
Easily craft the perfect data story by using our visual storyboard template.
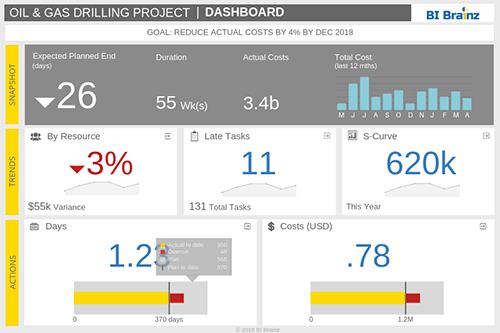
Add the ‘wow’ effect and cut design time in half with one of our professionally designed data visualization templates.
Build data visualizations in any BI tool and create a scalable model for your business.
Secure future business trust and funding with a solid social launch! Turn users into champions.
We love success stories…
Want to see what our BI methodologycan do for you?
Let us show you a free inside look at how our unique consulting services can start delivering amazing analytics within 72 hours!
Ask us a question, or lets arrange a time to talk!
SCHEDULE A
Start here. We’ll arrange a time to talk this week about your BI project.


 love success stories…