No one becomes a dataviz guru without help and insight from top industry experts. Following data visualization professionals on twitter is a great way to develop your understanding of big data and analytics. We’ve compiled a list of ten amazing industry experts that all have something important to say about big data and data visualization online.
As thought leaders, they represent a fountain of information on current trends and practices within the analytics industry that you can apply to your own work. Add them to your feed for interesting, informative insights that will help you manage big data decisions and apply them to growing your business.
1. Enrico Bertini
An assistant professor at the NYU Polytechnic School of Engineering and author of the Fell in Love with Data blog, Enrico Bertini is deeply entrenched in the field of data visualization. His thesis for his PhD in computer engineering focused on information visualization and he currently researches and teaches on the same subject. Follow him at @FILWD.

… one amazing thing about students is that there is always something to learn from them, especially if you look carefully.26:03 PM – Jun 11, 2015Twitter Ads info and privacySee Enrico Bertini’s other Tweets
2. Marcus Borba
If you want to understand how to integrate the many facets of big data and data visualization into one cohesive whole, Marcus Borba is the one to follow. The CTO at Spark Strategic Business Solution, Borba is known as an expert in big data, data management, visualization, business intelligence and business strategy. Add @marcusborba to your feed to take advantage of his extensive knowledge.View image on Twitter
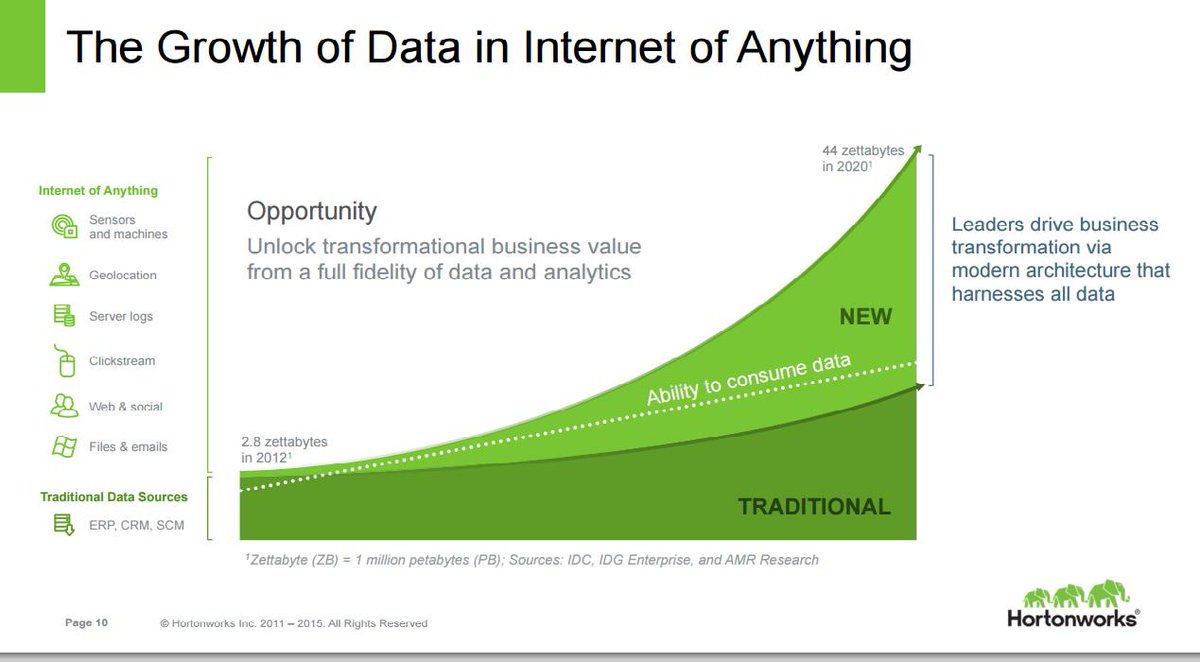

#BBBT @hortonworks #BigData #IoT The Growth of Data in Internet of Anything 55:34 PM – Aug 28, 2015See Marcus Borba’s other TweetsTwitter Ads info and privacy
3. Jeffrey Heer
Following @jeffrey_heer gives you access to the wide-ranging experience of Jeffrey Heer, the lead developer of such data visualization tools Prefuse, Flare and Protovis. When it comes to making big data easier to understand, Heer knows how to provide what businesses need to succeed.View image on Twitter
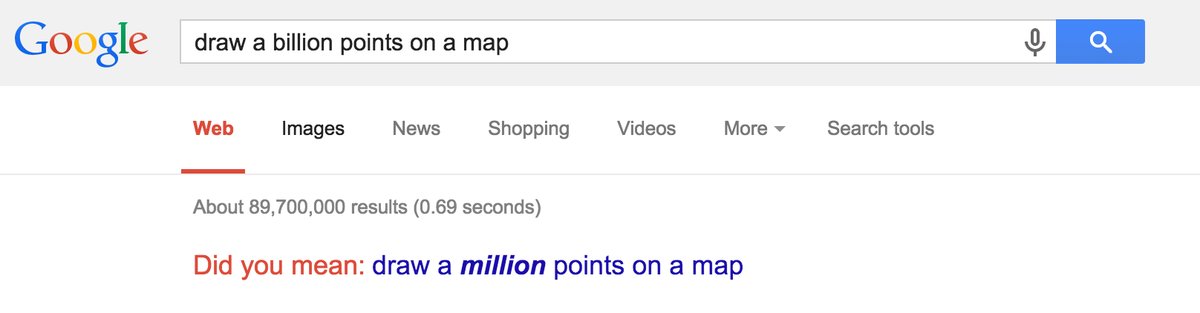

Visualizing big data? Google suggests data reduction… Hat tip to @domoritz and @uwdata 521:52 AM – Jan 23, 201533 people are talking about thisTwitter Ads info and privacy
4. Noah Iliinsky
Author of Designing Data Visualizations, Noah Iliinsky specializes in information design and speaks about visualization design best practices for industries. His website, ComplexDiagrams.com, states that he likes “to build things that are helpful and educational,” a goal supported by his past experience with interactive design. Follow Noah at @noahi.

Step 5: What graph do I use?
4: What data matters?
3: What Q’s need answering?
2: What actions do I need to inform?
1: What do I care about?2379:34 PM – Jan 17, 2014Twitter Ads info and privacy148 people are talking about this
5. Aaron Koblin
Aaron Koblin is the recipient of the 2014 National Design Award for Interactive Design and currently serves as the CTO for Vrse, Inc. His fresh perspective on data visualization makes following @aaronkoblin a smart choice if you want to take your business to the next level.

So impressed with what these guys have created. This is what interactive storytelling should look like. Must see. https://twitter.com/vhxtv/status/605805412642779136 …Vimeo for Sellers✔@vimeosellersCLOUDS: The very first VR interactive documentary to release online, powered by VHX http://bit.ly/1FqePwU #cloudsdoc 398:07 AM – Jun 3, 2015Twitter Ads info and privacy15 people are talking about this
6. Alberto Cairo
Alberto is a data and analytics lecturer at the university of Miami. He is also the author of the book The Functional Art as well as the popular blog of the same name. His observational tweets are incredibly useful and always relevant. As an avid reader he often posts great extracts from the data and analytics books he is reading. Alberto is a never ending stream of wit, imagination, insight and humour. Follow him at @albertocairo and look for more from him on this blog.

Some #dataviz authors become more convinced of their own opinions when reading research. For others, learning is a sure path to uncertainty102:06 AM – Aug 25, 2015Twitter Ads info and privacySee Alberto Cairo’s other Tweets
7. Scott Murray
Data visualization is one of Scott Murray’s major interests. He focuses on creating “design experiences that encourage people to slow down and reflect.” As an Assistant Professor of Design at USF and author of a book entitled Interactive Data Visualization for the Web, Murray has a lot to offer businesses that follow his @alignedleft Twitter feed.

90% of innovation is daring to use poorly documented open source projects658:54 PM – Aug 30, 2015Twitter Ads info and privacy64 people are talking about this
8. Cole Nussbaumer
Follow Cole Nussbaumer at @storywithdata to learn how to move away from ineffective graphics and utilize big data visualization to tell stories about your business. Nussbaumer’s insights will help you make better sense of company data and use it to improve all aspects of business operations.

Pick a chart not only based on the data, but also the task – great advice from @eagereyes: https://eagereyes.org/blog/2015/the-point-of-a-chart …41:51 AM – Aug 28, 2015Twitter Ads info and privacyThe Point Of A ChartWhen creating charts, it’s important to pick the one that actually fits not just the data, but the task. That can require going outside your comfort zone to use something beyond the four or f…eagereyes.orgSee Cole Knaflic’s other Tweets
9. Gregory Piatetsky-Shaprio
Being the president of the analytics and data mining consulting company KDnuggets puts Gregory Piatetsky-Shapiro in a position to help businesses bring diverse groups of data together. Follow @kdnuggets for valuable insights into data mining and knowledge discovery.View image on Twitter
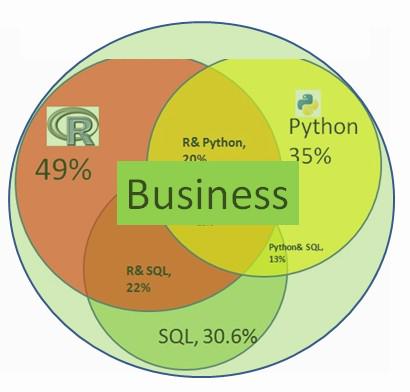

The one language a #DataScientist must master (it is not R, #Python or #SQL) http://buff.ly/1O5KvOk 7711:20 PM – Sep 1, 2015115 people are talking about thisTwitter Ads info and privacy
10. Naomi B. Robbins
Naomi B. Robbins speaks extensively to nonprofits, corporations, government agencies, universities and various societies on the subject of creating effective graphs. If you have problems making sense of big data, start following @nbrgraphs and check out her book, Creating More Effective Graphics.

Would you call a tool for data visualization beautiful? If so, what do you mean by beautiful? What tools do you think are beautiful? #SXSW14:18 PM – Mar 9, 2015Twitter Ads info and privacySee Naomi B Robbins’s other Tweets
Following big data visualization experts on Twitter gives you a better grasp of what’s going on in the world of data and how you can apply it to your own business to increase success. Take advantage of the opportunity to interact with these thought leaders and grow your network, and one day you may become one of the “go-to” people for data visualization information.