We teach you how to deliver Analytics using a proven process users ❤️ love!

Is your reporting delivery process broken? Our framework can help.

Power BI    ·    Tableau      ·  Excel   

Slide to see how our BI Dashboard Formula methodology transforms how BI projects are delivered

Delivering successful BI projects has never been this easy!

Skyrocket 
User Adoption

Show your users the true value of their data with well-designed analytics, not new technology.

Access Data Anytime

Give your users the gift of real-time data when they need it the most with a highly, scalable business model.

Meet Heather, Head of BI at Mobile Mini

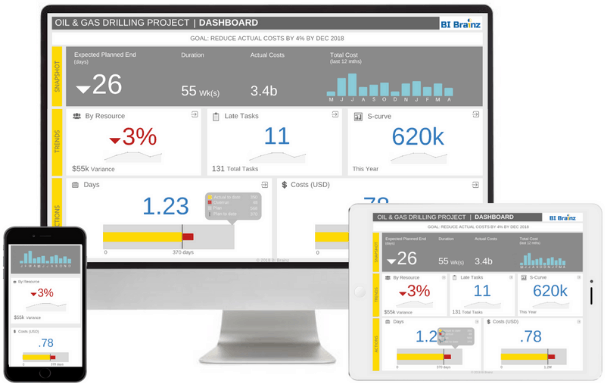
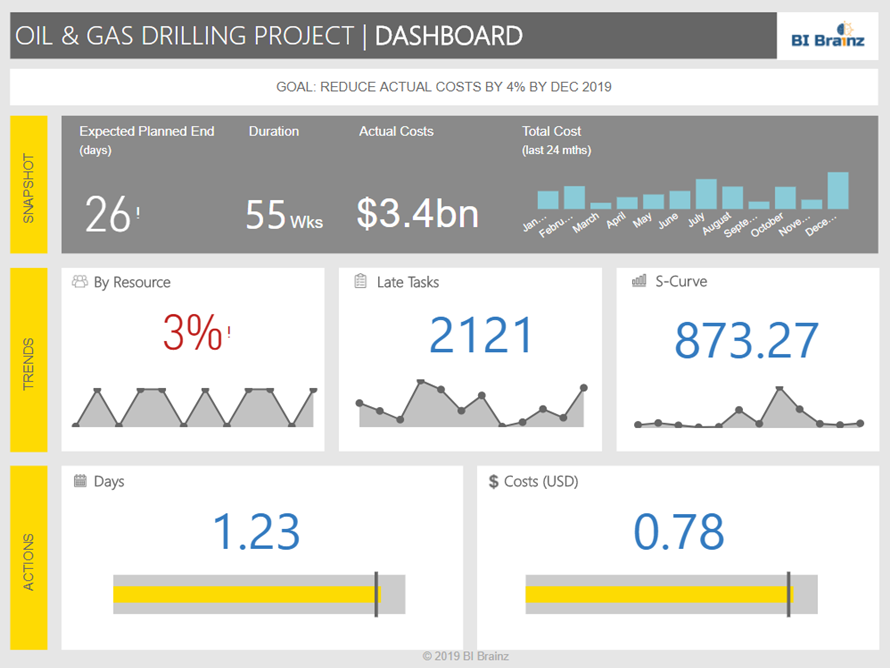
who worked with BI Brainz to build their real-time database platform, retire their old data warehouse, and  launch their first Executive dashboard!

“The platform gave executives insights faster than any they’d experienced before, granting them real-time data access via any device… so they could take action over the course of the day.”

Engage users
with Stories

Keep your users highly engaged during workshops with our interactive visual storyboards, not more reports.

BI Brainz KPI Blueprint Screenshot

Eliminate
Scope Creep

Help your users quickly define actionable goals, KPIs and metrics by using our bulletproof BIDF KPI Blueprint, not Outlook.

Meet Jonathan, Manager of IT Applications, BI & Analytics at Middlesex Health

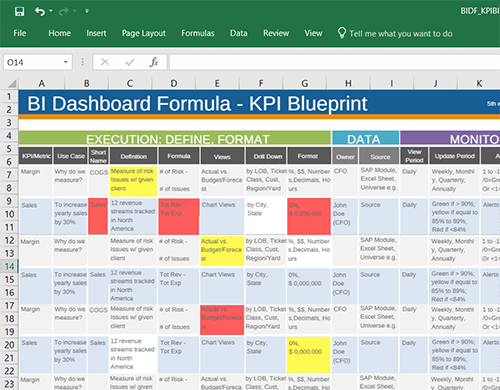
after attending our workshop, he used our BIDF KPI Blueprint to transform how he engaged business leaders and built smart KPIs.

“There’s a formality and a process to creating a KPI – and that didn’t really exist here prior to the BIDF Methodology…. for a while there (without the methodology) it was like the wild west.”

We ❤️ Happy Customers!

Over 6,000 data professionals globally use the BI Dashboard Formula Methodology

Want to see what our BI methodology
can do for your BI team?

Get a free inside look at how our unique consulting program can help your team  deliver consistent,  amazing analytics users love in 72 hours!

Check out our Top Resources

Just download the PowerPoint template, replace the details with your org’s colors, fonts, etc, then share with your team. 

Tune in as Santosh Kanthety Head of Data at NextEra Energy shares his tips on launching a thriving community in your org!

Finally, an online course that will teach you how to easily setup, build and design your first compelling data story!

This essential list is our go-to for data storytelling tools, blogs, and books. Bookmark the page, we update it often. 

SCHEDULE A

FREE CONSULTATION

Start here. We’ll arrange a time to talk this week about your BI project.

GET IN TOUCH

Ask us a question, or lets arrange a time to talk!

Want to learn how to use our FREE 50-page Analytics Design Guide?