What to Expect at the BI Data Storytelling Accelerator
Discover Why our BI Data Storytelling Accelerator Virtual Workshop is not like any other Data Storytelling Workshop You’ve ever Attended!

Discover Why our BI Data Storytelling Accelerator Virtual Workshop is not like any other Data Storytelling Workshop You’ve ever Attended!
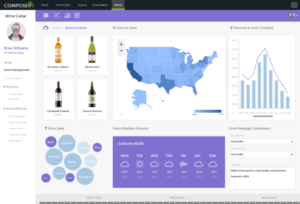
Dashboards are NOT the future of BI.” That single statement from one of our Analytics on Fire podcast guests, Nick
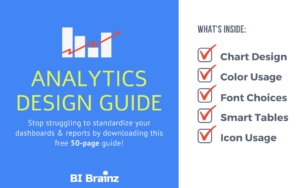
Let’s face it. Design is hard. Especially when it comes to designing dashboards and reports for someone else! That’s why
As the need for organizations to gain insight from their data soars to an all-time necessity, many companies have spent
Google Chief Economist Hal Varian predicted that data storytellers are the future over a decade ago. With data as the
If data is king, why are most companies today still struggling with tons of data but very little knowledge? The
I l-o-o-o-v-e Icons! Especially flat icons! They’re small, fun and very useful when it comes to data visualizations. They foster
An ugly Business Intelligence dashboard can turn your idyllic data visualization dreams into grotesque nightmares, and it’s not just a
While creating slides for an upcoming keynote on visual data storytelling I had a revelation! One of the main reasons

It’s no secret that all across the web, people are generating billions of gigabytes of data per day. This huge amount
Over the years, we have worked on collecting analytics data storytelling resources and have been asked numerous times to share

Struggling to find the right KPIs? You are not alone. KPIs (key performance indicators) measure the effectiveness of a company’s
No one becomes a dataviz guru without help and insight from top industry experts. Following data visualization professionals on twitter is

KPI overload. Most enterprises suffer from it, but very few know how to overcome it. While some BI analysts recommend
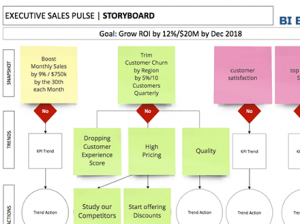
Could Visual Storyboarding bridge the gap between business intelligence and data science? We sure think so. As the keynote speaker at
Get a backstage pass into our BI Brainz lab. We’ll show you unconventional ways to boost user adoption rates, design amazing data visualizations, avoid scope creep, and keep your users happy. The old ways are broken. Let’s change the BI world together.